
Related publications
| Article | JHEP 11 (2023), 160 |
| Preprint | hep.th/2403.16217 |
| Dataset | DOI 10.5683/SP3/NLEDGH |
| Slides | 2024 CAP Congress |
| Slides | Theory Canada 16 |
| Slides | Amplitudes 2024 |
| Slides | William Tutte Colloquium June 21, 2024 |
Distribution and Symmetries of Feynman integrals
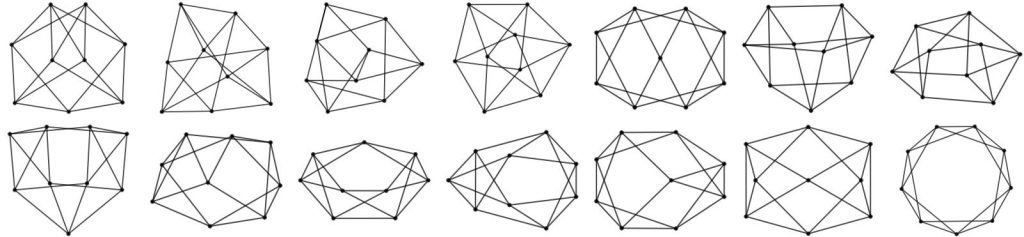
Feynman periods are the Feynman integrals of subdivergence-free superficially divergent graphs. In ϕ4-theory, these are the cyclically 6-edge connected vertex-type graphs. When the 4 edges of the vertex graph are joined to a new vertex, one obtains a vacuum graph, called “completion”. Removing any of the vertices of a completion gives a vertex-type graph, typically they are distinct, but still all their periods coincide. The period in ϕ4-theory has a few other, similar, symmetries that relate non-isomorphic graphs. I have written a new program to compute all (known) symmetries up to 15 loops, these are over 50 million graphs. The number of graphs grows factorially with the size of the graph. Below are all 14 completions at 7 loops, at 13 loops there are already over 700,000. A valuable tool to generate graphs (which one then checks for subdivergences) is nauty.
Having generated tables of graphs and their symmetries, I used a numerical integration algorithm recently developed by Michael Borinsky to compute more than 2 million of these periods, including all periods at 13 and less loops, and samples up to 18 loops. Using the symmetries, one can combine the numerical results of those integrals that are supposed to be symmetric, increasing accuracy.
For the first time, it is now possible to examine the statistical properties of a wide class of Feynman integrals in a relatively generic theory (having no subdivergences is a restriction, but a much less severe one compared to e.g. planarity or only multiedge-type graphs). One finds that their distribution is overall smooth and concentrated around the average, but there are outliers that are much larger.

At 16 loops, the standard deviation of the distribution is approximately as large as the average. We find that planar graphs, on average, have larger integrals than non-planar ones. Neither the planar graphs, nor well-known classes like the zigzag, are good estimates of “typical” Feynman integrals. These and many more results have appeared in JHEP11 2023, 160.
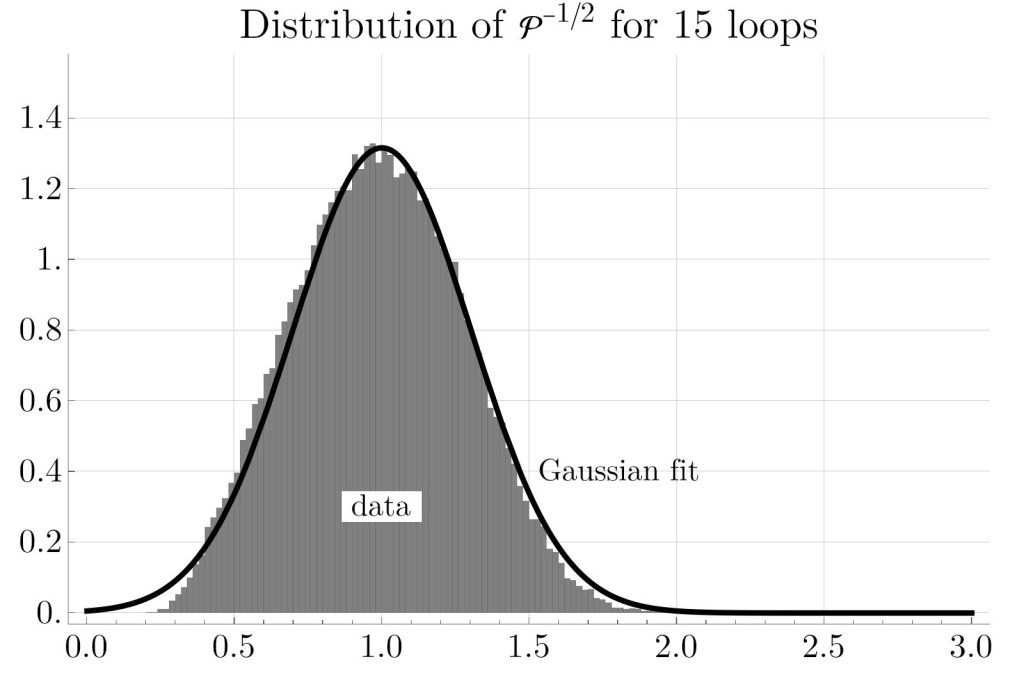
Besides straightforward statistical parameters, that examination has also produced some curious observations that I currently can’t fully explain. For example, while the distribution of periods  (i.e. when they are sampled with uniform probability) does not seem to follow any simple well-known distribution, the inverse square root
  , at higher loop order, looks almost like a Gaussian.

Correlations and importance sampling
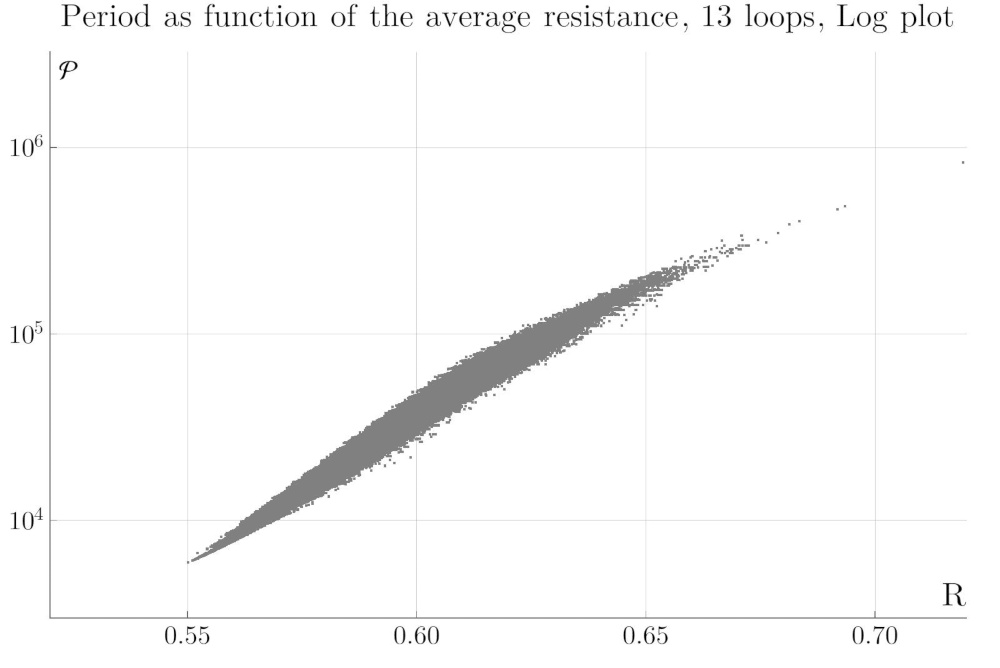
It turns out that the Feynman period is closely correlated to various properties of the graph, such as the number of certain cuts, the distribution of cycle length, or planarity and average vertex distance. A particularly curious one is the correlation with the electrical resistance: If we interpret the graph as an electrical network, graphs with large average resistance have large Feynman period. We also confirmed the strong correlation with the Hepp bound and the Martin invariant.
Knowing these correlations is not only useful for a general intuitive understanding of Feynman integrals, but it also allows us to tackle the problem of large standard deviations, mentioned above. For physical predictions, we need the sum of all Feynman integrals. We know their number relatively well, so we might equivalently compute the average. The number of distinct Feynman graphs grows factorially with loop order, at 16 loops in ϕ4-theory, there are approximately 1 billion periods. It is impossible to solve all these integrals. Normally one would resort to a (relatively small) random sample, say 10,000 distinct graphs. However, with the standard deviation being as large as the mean, this sample (which might already take weeks to compute) will only result in approximately relative 1% accuracy for the mean.
The correlations come to our rescue: Instead of sampling uniformly random, we can estimate the period of a given graph from the correlation, and use this for weighted sampling. In the preprint 2403.16217 together with Kimia Shaban, we demonstrate that this way, one needs roughly 1000-times less computation time to obtain the same accuracy of the mean, compared to uniform sampling. We conclude that perturbative computations in QFT at high order are not as hopeless as they at first seem. Even if the number of graphs is spectacularly large, one can exploit their statistical properties to get a surprisingly accurate estimate of their sum from integrating only a tiny fraction of them.
Periods dataset and machine learning
A large dataset of numerically computed Feynman periods in ϕ4-theory has been created in these projects. We have merged all numerical results and enforced the known symmetries. The resulting dataset is freely available under DOI 10.5683/SP3/NLEDGH.
In preprint 2403.16217, we examined machine learning algorithms to predict periods. While this works, it has (maybe unsurprisingly) proven more accurate to use the tailor-made physically motivated quantities like cuts and Hepp bound for approximations. Researchers interested in machine learning on graph-valued data (i.e. take a small dense graph as an input, produce a real number as an output) could use our dataset as a challenge or benchmark. The Feynman periods have the nice conceptual feature that the graph entirely determines the period in a deterministic way, so it should in principle be possible to reach 100% accuracy provided a machine learning algorithm is capable of “understanding” the Feynman integral encoded by the graph.